Program Profiling
The Visual PL/B IDE Studio provides a unique program profiler to help users optimize their programs.
1. To run the profiler, simply select the program desired in the Project window and then choose "Profile" from the Project Menu or press the F9 key.
2. The target program will then be compiled if necessary and execute as it normally does.
3. When the target
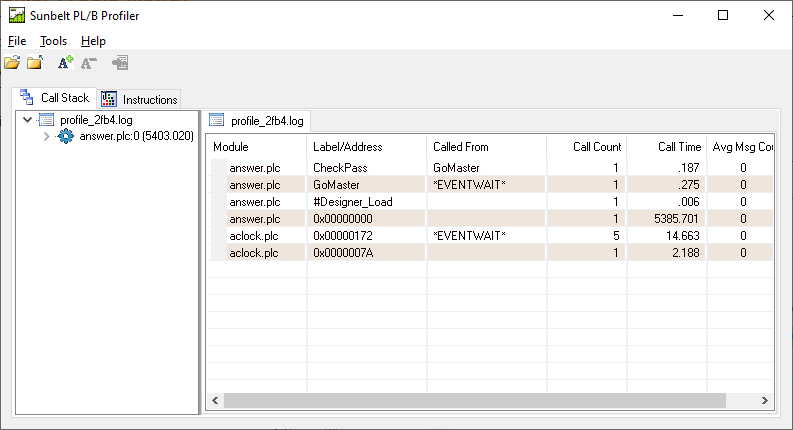
program terminates, the Profiler is executed and a window similar to the following is displayed:
What you see is a representation of the call stack executed. In the treeview on the left is a label and the execution time from the point that label was called to the time it returned or program exited. The time shown for a program run using the windows runtime is in thousandths of a second (i.e., 3828 is 3.828 seconds).
When you expand the treeview items, the time for lower level calls are subtracted leaving only the amount of time spent at the give call stack level.
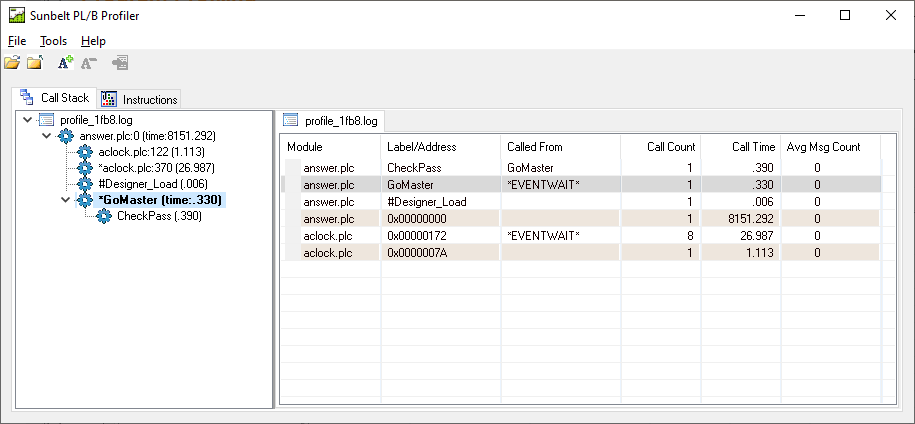
Labels that are called as a result of an event are marked with an asterisk in the treeview. In the listview, those same calls have *EVENTWAIT or *EVENTCHECK next to them to identify them as dispatched events rather than routines explicitly called.
The treeview and listview are synchronized with each other. When you select an item in the treeview, the corresponding item in the listview is selected and vice versa.
The listview contains additional information about a particular call to a routine such as the module containing the routine. This is helpful when profiling multiple loadmods or multiple instances of a loadmod. The listview also includes the number of times a particular routine was called. If a given routine is called from multiple locations within the program, those different calls will appear on the list separately. This layout gives a better view of the program flows.
If the debug file (.sdb) for a given program cannot be found, is not current, or for some reason does not match the object code file (.plc), some labels may not be resolved properly.
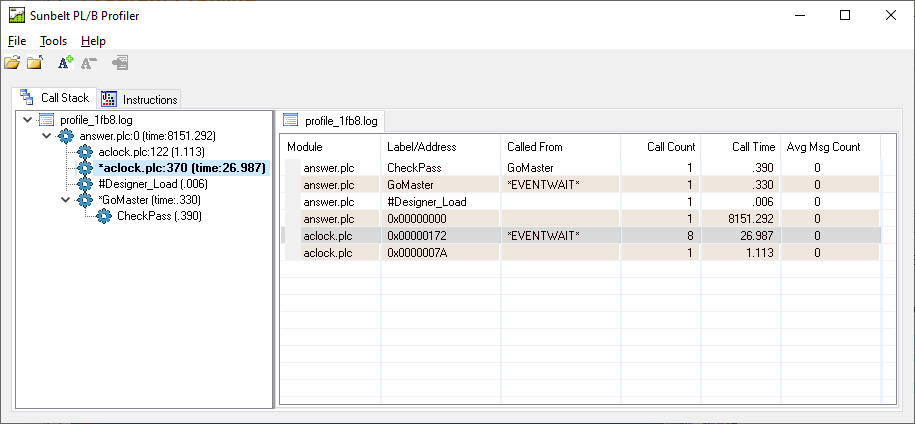
In these cases, the treeview shows the program module name with the program address of the routine that was called. When a routine is called multiple times, the “Call time” is the sum of all calls to that routine.
Other features:
You can click on the listview column headers to sort the list.
Use the Font +/- to increase or decrease the size of the font for your convenience.
The close button exits the profiler.


 |